| Frontiers | 您所在的位置:网站首页 › fatp cr c › Frontiers |
Frontiers
 Qi-Shun Geng1 Qi-Shun Geng1 Mei-Jia Yang2 Mei-Jia Yang2 Li-Feng Li2Zhi-Bo Shen2Long-Hao Wang2Yuan-Yuan Zheng2Wen-Hua Xue1 Li-Feng Li2Zhi-Bo Shen2Long-Hao Wang2Yuan-Yuan Zheng2Wen-Hua Xue1 Jie Zhao1,2*1Department of Pharmacy, The First Affiliated Hospital of Zhengzhou University, Zhengzhou, China2Internet Medical and System Applications of National Engineering Laboratory, The First Affiliated Hospital of Zhengzhou University, Zhengzhou, China Jie Zhao1,2*1Department of Pharmacy, The First Affiliated Hospital of Zhengzhou University, Zhengzhou, China2Internet Medical and System Applications of National Engineering Laboratory, The First Affiliated Hospital of Zhengzhou University, Zhengzhou, ChinaBackground: Fatty acid transporters (FATPs) family play an important role in the uptake and metabolism regulation of long-chain fatty acids, which influence the occurrence and developing of multiple tumors. Fatty acid transporter 5(FATP5), a member of FATPs family, participates in fatty acid transport and lipid metabolism and is related to tumor development, whose mechanism in colorectal cancer (CRC) remains unclear. Methods: In this study, we comprehensively utilized a range of relevant bioinformatic tools along with multiple databases to analyze the expression of FATPs family and investigate the biological function and prognostic value of FATP5 in CRC. Besides, cell proliferation and cell cycle distribution analysis, western blotting and immunohistochemistry (IHC) further validated the conclusion of bioinformatics analysis. Results: FATP5 is the only member of FATPs family which was overexpressed in CRC. In the survival analysis based on the GSE39582 databases, the low expression of FATP5 predicts poor prognosis in CRC. Similar results were also observed in GSE17536, GSE28814 and TCGA colon cohorts. The potential function of DNA methylation regulated the abnormal expression of FATP5 in CRC. In addition, enrichment analysis indicated that FATP5 also participates in the regulation of cell cycle. Furthermore, Gene Set Enrichment Analysis (GSEA) showed a strong negative correlation between FATP5 and cell growth, implying that it may participate in regulating cancer cell proliferation by the regulation of cell cycle G2/M transition. At last, we identified that FATP5 was overexpressed in colorectal carcinoma tissues through immunohistochemistry staining, and played an important role in cell cycle by cell proliferation and cell cycle distribution analysis. Conclusion: This study suggested that FATP5 was overexpression in colorectal carcinoma and predicted favorable prognosis, indicating it as a novel appealing prognostic marker for CRC. IntroductionDue to factors such as aging population, rapid population growth, and environmental pollution, cancer incidence and mortality continued to increase worldwide. Among all cancers, the morbidity and mortality of CRC were at the forefront of global cancer statistics, which indicate it ranks the third among the most frequently diagnosed cancers and that it’s the fourth leading cause of cancer death worldwide (Favoriti et al., 2016; Bray et al., 2018). With the application of diagnostic technology and equipment, screening can effectively reduce the incidence and mortality of CRC. However, due to economic conditions and social status, CRC screening was only available to a small part of the global population, which led to wide variations in the morbidity and mortality of CRC (Schreuders et al., 2015). Due to changes in multiple system such as blood and immunity, the pathogenesis of colorectal cancer was very complicated (Mlecnik et al., 2016). Studies focusing on the molecular mechanism of CRC occurrence and development can be beneficial to the diagnose and treatment of this malignant tumor. However, the overall 5-years survival rate for patients with CRC is still very low (Overman et al., 2017). Therefore, finding reliable biomarkers for early diagnosis, accurate prognosis and replacement therapy still wait for further discovery. Long-chain fatty acids (LCFA) are one of the main energy sources for cells, whose uptake and activation can affect many cellular processes, including membrane synthesis, intracellular signal transduction, and energy metabolism. The uptake of LCFA involves a variety of membrane proteins, such as FATPs (Stahl, 2004). The FATPs family consists of six members, FATP1-6, encoded by SLC27A1-6. FATPs are complete membrane proteins with at least one transmembrane domain, ranging in size from 63 to 80 KDa. The FATPs are also an indispensable transmembrane protein, which can enhance the absorption of long-chain and ultra-long-chain fatty acids to cells. All FATP members are located at the C-terminus, and have highly conserved 311 amino acid natural sequence, called FATP sequence, and AMP binding domain, which are responsible for LCFA binding and uptake. Despite the sequence similarity of FATP members, the proteins are differentially expressed in tissues and cell types (involving adipose tissue, liver, intestine, and endothelial cells, etc.) (Anderson and Stahl, 2013). FATP5 is a liver-specific member of the FATP family. The molecule of FATP5 is bile BAL, which catalyzes the binding of bile acids to amino acids and plays an unexpected part in bile acid metabolism. Previous studies indicated that FATP5 plays an important role in fatty acid transport, lipid metabolism, and weight regulation (Hubbard et al., 2006). Nevertheless, what role FATP5 plays in the progression of CRC is still ambiguous and remains to be elucidated. In this study, we utilized a wide range of comprehensive bioinformatics methods and molecular biology experiments to analyze FATP5 expression, potential function, and impacts on prognosis of human CRC, which provided a theoretical basis for future clinical research. The study identified the overexpression of FATP5 in colorectal cancer tissues by immunohistochemical staining and played an important role in cell cycle by cell proliferation and cell cycle distribution analysis (Figure 1). FIGURE 1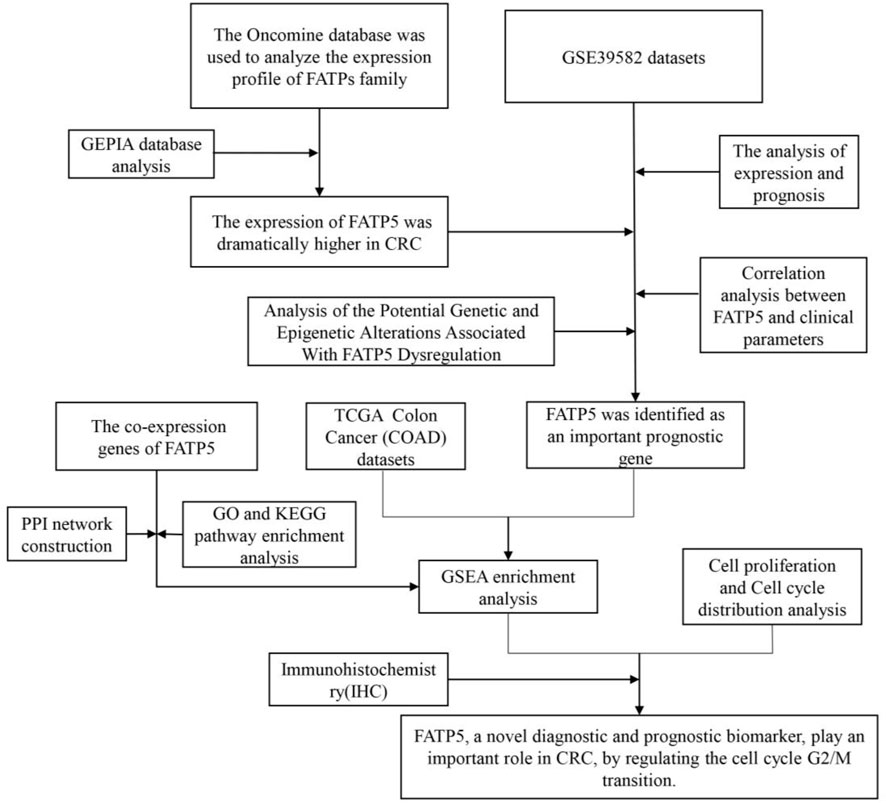
FIGURE 1. Flow diagram of the study. Materials and MethodsCell Culture and Cell TransfectionCRC cells including CACO-2 and HCT116 cells were acquired from Chinese Academy of Sciences (Shanghai, China). The cells were maintained in DMEM with 10% FBS (Thermo, United States) and cultured at 37°C, 5% CO2 and saturated humidity. FATP5-siRNAs (siFATP5) and control-siRNA (siNC) were chemically synthesized by Tsingke Biotechnology Co., Ltd (Beiing, China), and used for transfection into CRC cell lines. To silence the expression of FATP5, siRNAs specifically targeting to FATP5 was obtained. The target sequences of FATP5 is shown below: si-FATP5: 5-CAGAAGGCAACAUGGGCUUAGUCAA-3. JetPRIME® Transfection Reagent was used for cell transfection (Polyplus Transfection, United States). The Cancer Genome Atlas (TCGA) Database and Gene Expression Omnibus (GEO) DatasetsGene expression array in CRC tumor and related clinical information were downloaded from the GEO2. 566 cancer samples and 19 normal samples were obtained from GSE39582 (557 samples had prognostic information and 525 samples had clinical parameters). In addition, the expression profiling of CRC patients and survival information were extracted from GEO: GSE17536 (N = 177) and GSE28814 (N = 125) datasets. The acquisition of FATP5 transcriptome data from colorectal tumors in the TCGA dataset is available from the Cancer Genome Browser website of the University of California, Santa Cruz (http://xena.ucsc.edu/) (Goldman et al., 2019), which was also used to elevate the correlation of FATP5 and cell cycle regulation. We retrieved CRC tumor sample (n = 285) data from TCGA. The Oncomine Platform and GEPIA DatasetThe Oncomine platform (https://www.oncomine.org/resource/login.html) providing open access to cancer microarray database online was used to facilitate the analysis of genome-wide expression in various cancers (Rhodes et al., 2004). We used the Oncomine database to compare the mRNA expressions of FATPs between clinical colorectal cancer specimens and normal controls, whose purpose was to pick out genes that are significantly differently expressed in FATPs. In order to obtain the important gene probe, we set the following thresholds: p-value < 1e-4, fold change >2 and the gene ranks in the top 10%. The online database Gene Expression Profiling Interactive Analysis (GEPIA) (http://gepia.cancer-pku.cn/index.html), as a newly developed interactive web server, enables RNA sequencing expression data of 9,736 tumors as well as 8,587 normal samples from the TCGA and GTEx projects (Tang et al., 2017). The gene expression of FATPs was verified in the GEPIA database, which was also used to gauge the expression and overall survival of genes. cBioPortal Database and Catalogue of Somatic Mutations in Cancer (COSMIC) DatasetThe cBioPortal (http://cbioportal.org) Cancer Genomics portal serves as a resource offering open data to interactively explore multidimensional genomic datasets on cancer and currently has access to over 5,000 tumor samples from 20 cancer studies, which can greatly assist researchers to access molecular profiles and clinical attributes in extensive cancer genome projects, and enable scientific research personnel to transform abundant data sets into relevant biological information and clinical applications (Cerami et al., 2012; Gao et al., 2013). We applied this database to determine the genes that are positively associated with FATP5 expression in CRC and obtained related information of copy number alterations (CNAs). COSMIC(http://cancer.sanger.ac.uk)—the Catalogue of Somatic Mutations in Cancer—is the world’s largest source of professional manually-compiled somatic mutation information relating to human cancers (Tate et al., 2019). This database compiles data, which covers a wide range of the field of cancer genomics in terms of somatic mutations. Therefore, we used the database to analyze mutations of FATP5 in CRC. DNA Methylation AnalysisMEXPRESS(https://mexpress.be/) is a data visualization tool meant to simplify the visualization of TCGA expression, DNA methylation and clinical data, along with the relationships between them (Koch et al., 2019), which was used to complete data analysis and get relevant data. Pearson’s correlation between FATP5 gene expression level and methylation of its CpG islands was evaluated by using R software. The PPI (Protein-Protein Interact) Network Diagram Construction and Function Enrichment Analysis of Co-Expressed GenesThe String (http://string-db.org/) (Szklarczyk et al., 2019) database is a system that searches for interactions between proteins. We select multiple protein tools and define the species as human, obtain a PPI network of co-expressed genes, which was visualized by Cytoscape (version 3.7.2) software (Smoot et al., 2011). ClueGO (version 3.0.3) (Maere et al., 2005) is a plug-in playing the character to visualize the nonredundant biological terms for large clusters of genes in a functionally-grouped network, which executed the biologic process of functional annotation analysis of co-expressed genes as well. DAVID Bioinformatics Resources (http://david.abcc.ncifcrf.gov/),a comprehensive biological biology and analysis tool that systematically extracts biological significance from gene or protein lists, was used for function enrichment analysis (Huang et al., 2009a; Huang et al., 2009b). Gene Set Enrichment Analysis is a computational method employed to determine whether a priori defined set of genes shows statistically significant, consistent difference between two biological states. Each sample was defined as either “H” or “L”, depending on whether it was greater than the median mRNA expression value of FATP5. GSEA was performed using clusterProfiler package with gene set c5 (c5. go.v7.4. symbols.gmt). Cell Proliferation and Cell Cycle Distribution AnalysisCCK-8 assays were performed by a CCK-8 kit from Beyotime (Beijing, China). In brief, cells in log phase growth were planted in 96-well dishes at a concentration of 5 × 10³ cells/well and cultivated in DMEM containing 10% FBS for cell attachment. Cell viability was detected with CCK-8 reagent followed by the protocol of manufacturer at the indicated time point (24, 48 and 72 h). Propidium iodide (PI; Sigma, P4170) staining was used to analyze DNA content and cell cycle profile. Assays were performed 48 h after the transfection of siNC and siFATP5. Cells were washed twice with ice-cold PBS, harvested, and fixed with 70% ethanol at 4°C overnight. Cells were resuspended in PBS, permeabilized with 0.125% Triton X-100 (Sigma-Aldrich, T9284) and stained with 40 μg/ml PI for 30 min on ice. Cell cycle distributions were analyzed by flow cytometry (ACEA NovoCyteF, Agilent). qRT-PCR, Western Blotting and Immunohistochemistry(IHC)TRIzol reagent (Invitrogen, Carlsbad, CA, United States) was used to extracted RNA from cells. Complementary DNA (cDNA) was synthesized from total RNA using PrimeScript RT reagent Kit (Takara, Dalian, China), and PCR was performed using SYBR Green RT-PCR Kit (AG11701, ACCURATE BIOTECHNOLOGY, HUNAN,Co.,Ltd.). GAPDH served as an internal control. PCR was run on the StepOne Plus Real-Time PCR System (Applied Biosystems, Foster City, CA, United States), and data were analyzed using the 2-ΔΔCT method. The primer sequences used in the experiment is as follow. FN1, 5′- GCTCCCTGCCTATGCCACACC-3′ (forward), 5′- CACACACAGCCTGGTACACAT-3′ (reverse). Cells were lysed using RIPA buffer (Beyotime) supplemented with protease inhibitor cocktail (Thermo Scientific, Waltham, MA, United States) and PMSF. A BCA method was used to measure the protein concentration. 40 μg cell lysates were subjected to sodium dodecyl sulfate-polyacrylamide gel electrophoresis (SDS-PAGE), transferred to polyvinyldene fluoride (PVDF) membrane (Sigma, St Louis, MO, United StatesA). The membrane was incubated with specific antibody for FATP5 (1:1,000 dilution;Affinity, DF3845), p27 (1:1,000 dilution; Affinity, AF6324) and CCNB1 (1:2000 dilution; proteintech, 67686-1-Ig), followed by incubation with horseradish peroxidase-conjugated anti-IgG. Autoradiograms were densitometrically quantified (Quantity One software; Bio-Rad), with Β-actin serving as internal control. Immunohistochemistry of colorectal cancer arrays (HCol-Can060 PT-01, SHANGHAI OUTDO BIOTECH CO,LTD.; National Engineering Center for Biochip at Shanghai; National Human Genetic Resources Sharing Service Platform, 2005DKA21300, China) was performed by using FATP5 antibody (1:200 dilution; Affinity). Briefly, after xylol deparaffinization and rehydration in graded alcohols, colorectal cancer arrays were boiled in citrate buffer, pre-incubated with H2O2, and blocked with rabbit or goat serum (DAKO, Glostrup, Denmark). Arrays were then incubated with a primary antibody and then with an HRP-conjugated secondary antibody. Before counterstaining with hematoxylin, diaminobenzidine was used to develop the target proteins. The IHC staining was evaluated by applying a scoring system from 0 to 3 (0 = negative or no staining, 1 = weak or low staining; 2 = moderate or intermediate staining; and 3 = strong or high staining), which determine the score for each tissue based on the percentage of positive cells and intensity of staining. The arrays were read by a pathologist using Olympus BX41 microscope. Statistical AnalysisBy default, all statistical analysis is performed as described in the web resources. In short, the Student’s t-test is used to compare the expression of mRNA in the Oncomine database. GEPIA difference analysis uses one-way ANOVA by defining disease status (tumor or normal) as a variable. Spearman correlation analysis was used to evaluate the correlation of gene expression in cBioPortal and UCSC databases. Fisher’s exact test is used to measure gene richness in annotated terms in David’s annotation system. Besides, the χ2 test was utilized for analysis on correlation between FATP5 expression and clinical parameters. Univariate and multivariate analyses were performed using Cox proportional hazard model. p < 0.05 indicates statistical significance (*, p < 0.05; **, p < 0.01). ResultsOverexpression of FATP5 in Colorectal CancerThe Oncomine database was used to analyze the expression profile of FATPs family. We found that the expression of FATP1 and FATP5 was significantly elevated in colorectal cancer (Figure 2A). Then, we determined the expression of FATP1 and FATP5 using GEPIA database, which further validated FATP5 was the only member of FATPs family that upregulated in colorectal cancer tissues compared to normal (Figures 2B,C). What’s more, Oncomine analysis of cancer vs normal samples in different patient datasets showed that the expression of FATP5 was dramatically higher in colon adenoma, colon carcinoma epithelia, colon mucinous adenocarcinoma and rectal adenocarcinoma (Figure 2D; Table 1). FIGURE 2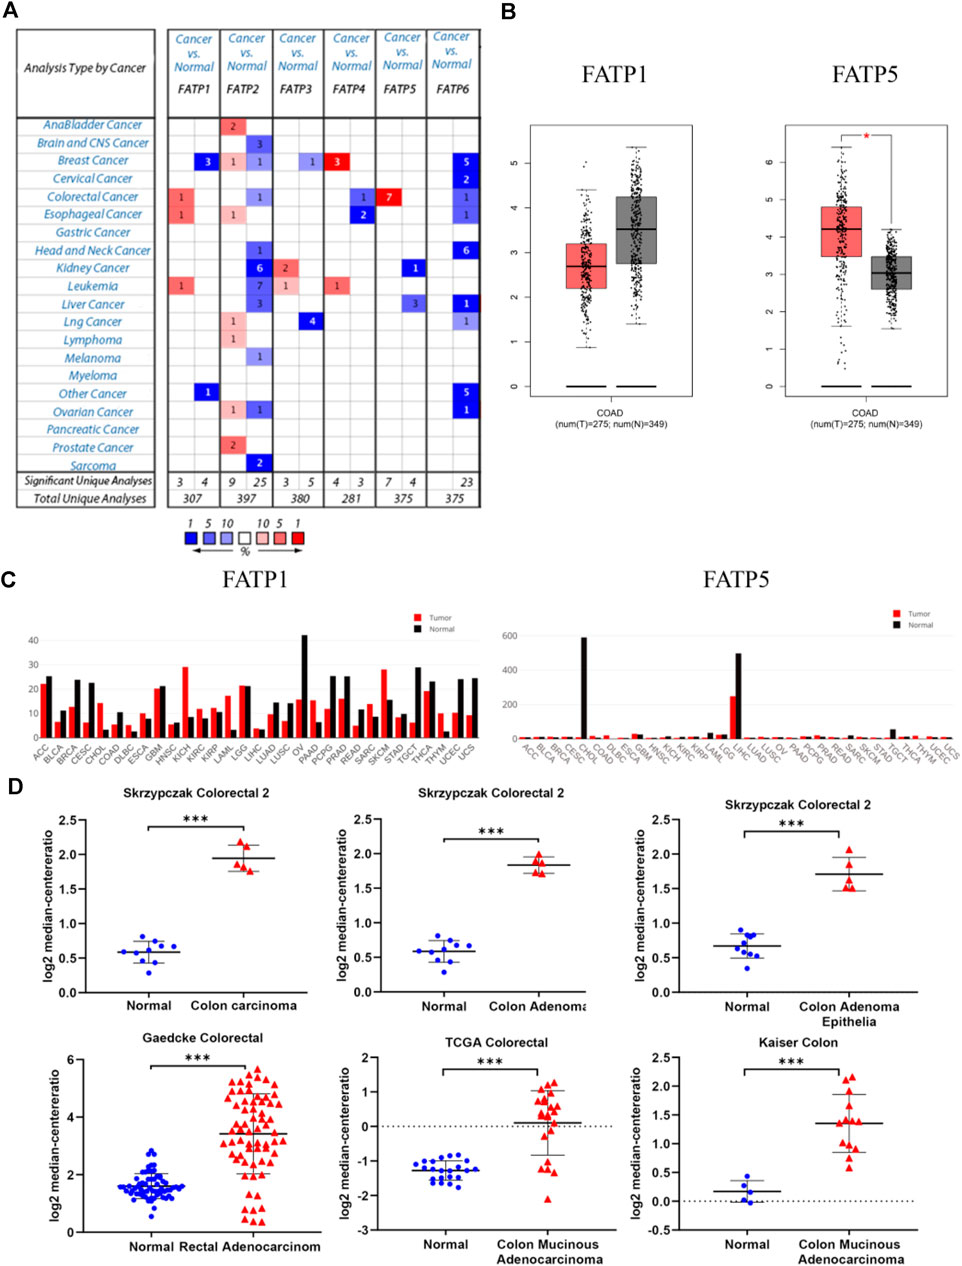
FIGURE 2. FATP5 mRNA expression was elevated in human colorectal cancer (CRC). (A) Using the Oncomine database, this graph shows the numbers of datasets with statistically significant mRNA overexpression (red) or downexpression (blue) of FATPs (cancer tissues vs corresponding normal tissues). The threshold was defined with the following parameters: p-value of 1E-4, fold change of 2 and gene ranking of 10%. (B–C) The GEPIA database verified that FATP5 gene expression was significantly upregulated in colon cancerFATP1 tissues (n = 275) compared with normal colon tissues (n = 349), *p < 0.05. (D) The Oncomine database analysis of FATP5 gene expressions in different subtypes of colorectal cancer, ***p < 0.001. TABLE 1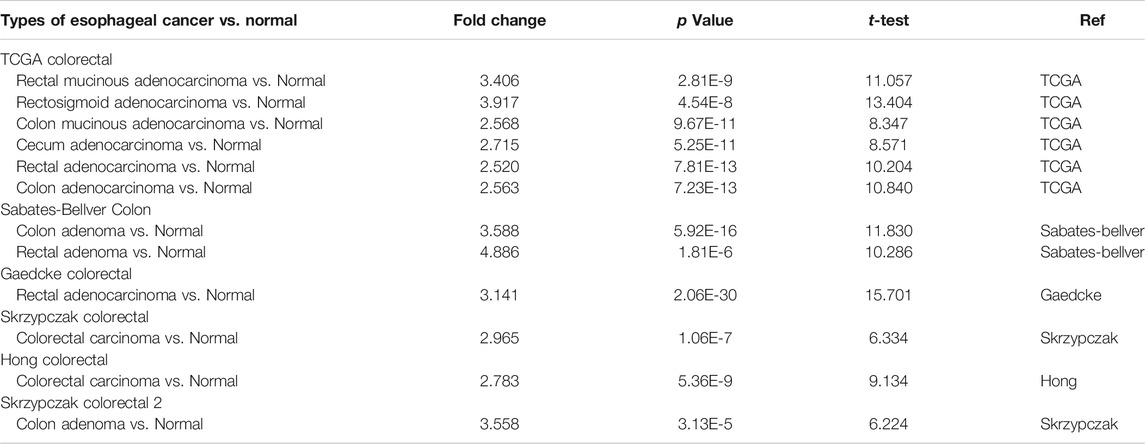
TABLE 1. The Oncomine database analysis indicated that FATP5 expressions are upregulated in different subtypes of colorectal carcinoma. Low FATP5 Expression Predicts Poor Prognosis in Colorectal Cancerχ-tile 3.6.1 software was used to identify the optimum cut-off value for distinguishing high-expression FATP5 patients from low-expression FATP5 patients. Low-expression FATP5 patients had shorter overall survival (OS) (HR = 1.65; 95% CI: 0.216–2.35; p < 0.01) and shorter relapse free survival (RES) (HR = 1.57; 95% CI: 1.17–2.1; p < 0.01) than patients with high-expression FATP5 patients (Figures 3A,B). To determine whether the FATP5 expression for predicting prognostic was robust, the performance of the FATP5 expression was assessed in three independent colon cohorts, which totally consisted of 587 colon patients. The optimum cut-off value for colon cohorts was identified with χ-tile 3.6.1 software, based on the expression of FATP5. Similar results were observed in GSE17536, GSE28814 and TCGA colon cohorts, which suggested that low-expression FATP5 group had significantly worse OS than those who were assigned to the low-expression FATP5 group according to the expression of FATP5 (Figure 3C). We further compared the clinical characteristics (including age, sex, location, clinical stage, and tumor grade) between FATP5 expression-high and low groups and managed to observe obvious statistics differences in lymph node metastasis and distant metastasis, while no observation for other clinical features indicated significant differences (Table 2). In addition, the univariate and multivariate Cox regression model using GSE39582 accession demonstrated that distant metastasis and FATP5 expression were irrelevant prognostic factors for OS of patients with CRC (Table 3). In order to further illustrate the importance of FATP5 for prognosis, we construct a nomogram based on clinical parameters and the expression of FATP5 (Figure 3D). The ROC and the calibration curves indicated decent accuracy (Area Under Curve (AUC) of 1-year survival: 0.828; AUC of 5-years survival: 0.738) and good discrimination (C-index = 0.763) (Figures 3E,F). FIGURE 3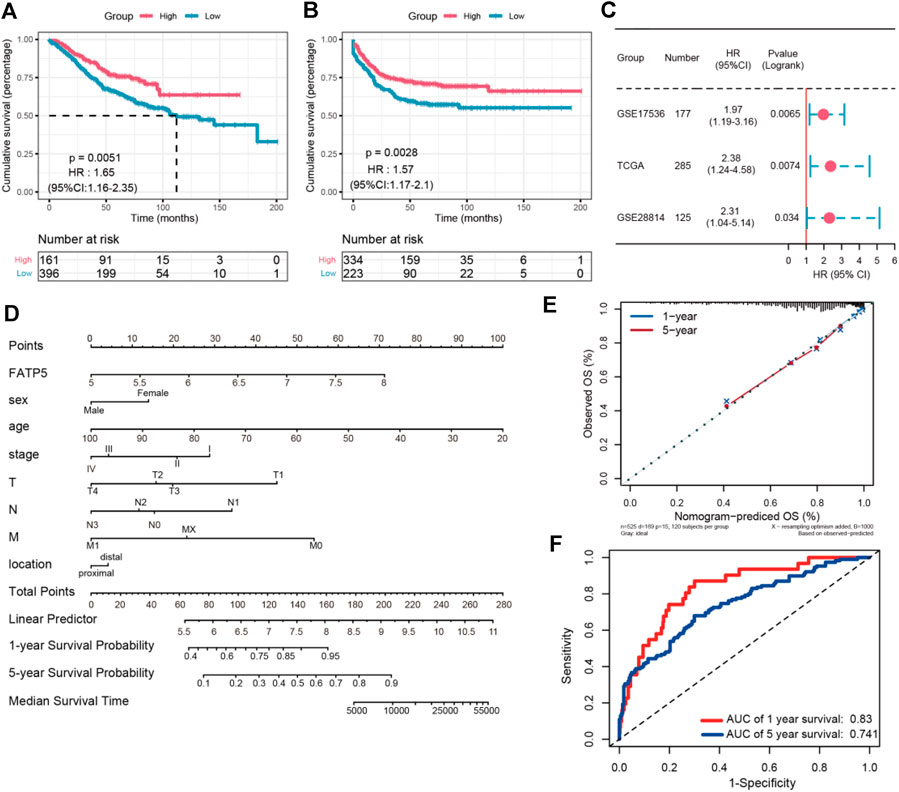
FIGURE 3. The survival analysis of FATP5 in human colorectal cancer. The overall survival (A) and relapse free survival (B) of FATP5 in colorectal cancer based on GSE39582 accession. (C) The survival analysis of FATP5 in GSE17536, GSE28814 and TCGA colon cohorts. (D) A nomogram consisting of risk score and other clinical indicators for predicting 1-, and 5-years OS of CRC. (E) Calibration plot of nomogram for predicting probabilities of 1, and 5-years overall survival of patients. (F) Time-dependent ROC for 1-, and 5-years OS predictions for the nomogram compared with actual observations. TABLE 2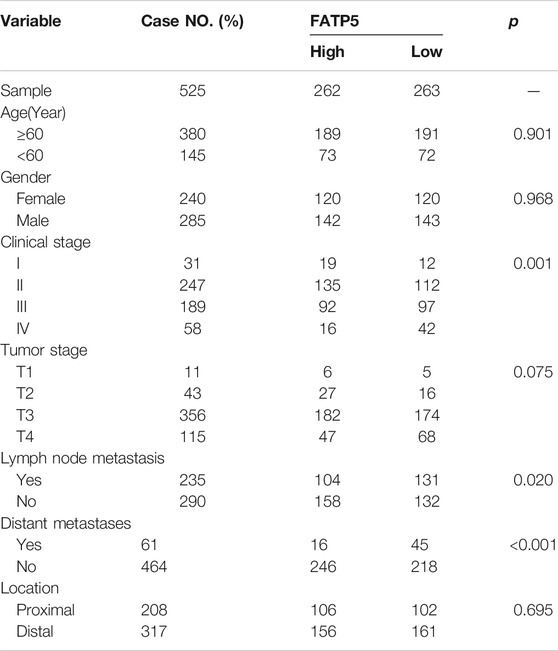
TABLE 2. Comparison of clinical characteristics between low-expression FATP5 group and high-expression FATP5 group in GSE39582 cohort. TABLE 3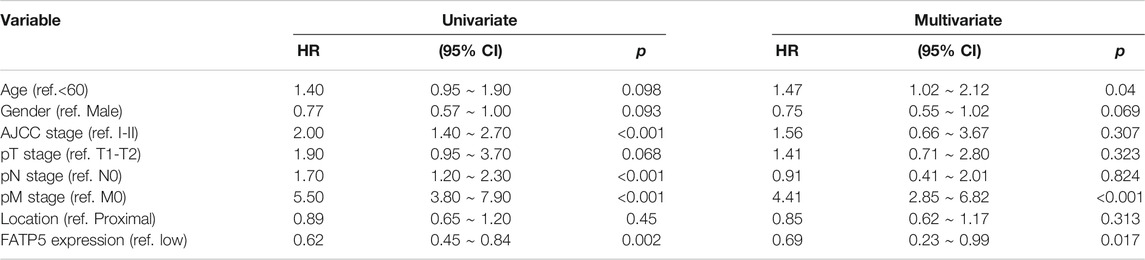
TABLE 3. Univariate and multivariate regression analyses for predicting overall survival in GSE39582 cohort. Analysis of the Potential Genetic and Epigenetic Alterations Associated With FATP5 DysregulationConsidering rare mutation and significant prognosis of FATP5, we next explored the potential mechanism of FATP5 abnormal expression in CRC. Copy number alterations (CNAs) has been confirmed as a fundamental mechanism of oncogene activation in tumor (Chang et al., 2020). Aimed to ascertain whether there is firm evidence to establish the casual association between CNAs and the abnormal expression of FATP5 in CRC, we analyzed data with CNAs available in TCGA dataset by using CbioPortal tool. The patterns of CNAs were no significant differences in the FATP5-high and low groups (Figures 4A,B). Analogous to CNAs’ activating oncogene function, studies integrating DNA-methylation profiles and gene expression data have testified that methylation in different genomic regions is related to gene expression levels (Moore et al., 2013). To investigate whether DNA methylation results in FATP5 dysfunction, MEXPRESS was used to examine the status of CpG sites in colorectal carcinoma (Figure 4C). There are 15 CpG sites with a significant correlation with the expression of FATP5 (p < 0.05); among them, 14 CpG sites, including cg23478354, cg22309518, cg07061962, cg05983698, cg09364328 etc., were negatively correlated with FATP5 expression. Then, we employed the Pearson correlation coefficient to the five CpG sites with the greatest correlation and found that FATP5 expression was negatively correlated with the five CpG sites (Figure 4D, p < 0.001). Collectively, these data demonstrated the potential function of DNA methylation in regulating the abnormal expression of FATP5 in CRC, showing the potential mechanism is worth further exploring. FIGURE 4
FIGURE 4. Analysis of the potential genetic and epigenetic alterations associated with FATP5 dysregulation. (A,B) The CNAs in FATP5-high and low expression groups. (C) Analysis of CpG island methylation and abnormal FATP5 expression using TCGA dataset. (D) Correlation between FATP5 expression and CpG island methylation was performed. ***p < 0.001. PPI Network Construction and Analysis of Co-expression GenesThe cBioPortal dataset was applied to obtain 29 genes in protein expression that are correlated with FATP5 in mRNA expression (p-value |
【本文地址】